All official European Union website addresses are in the europa.eu domain.
See all EU institutions and bodies
An official website of the European Union | How do you know?
Environmental information systems
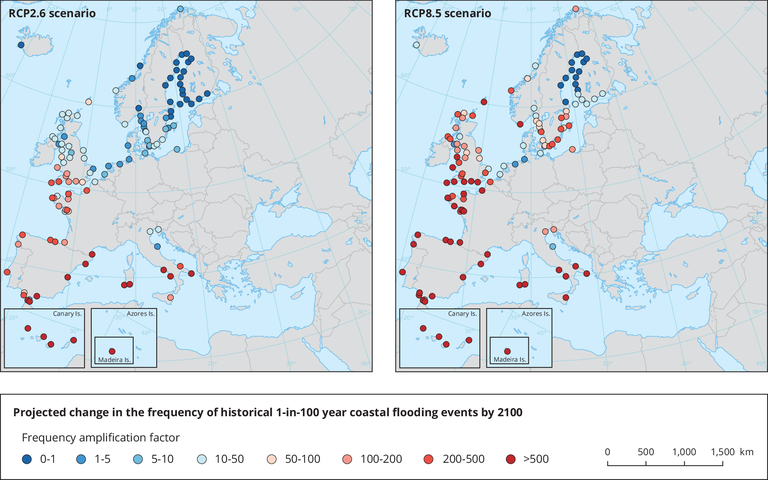
This maps show the estimated multiplication factor, by which the frequency of flooding events of a given height changes between 2010 and 2100 due to projected regional sea relative level rise under the RCP2.6 and RCP8.5 scenarios. Values larger than 1 indicate an increase in flooding frequency.
Adapted from Figure 4.12 of the Intergovernmental Panel on Climate Change (IPCC) Special Report on the Ocean and Cryosphere (SROCC).
Loading