All official European Union website addresses are in the europa.eu domain.
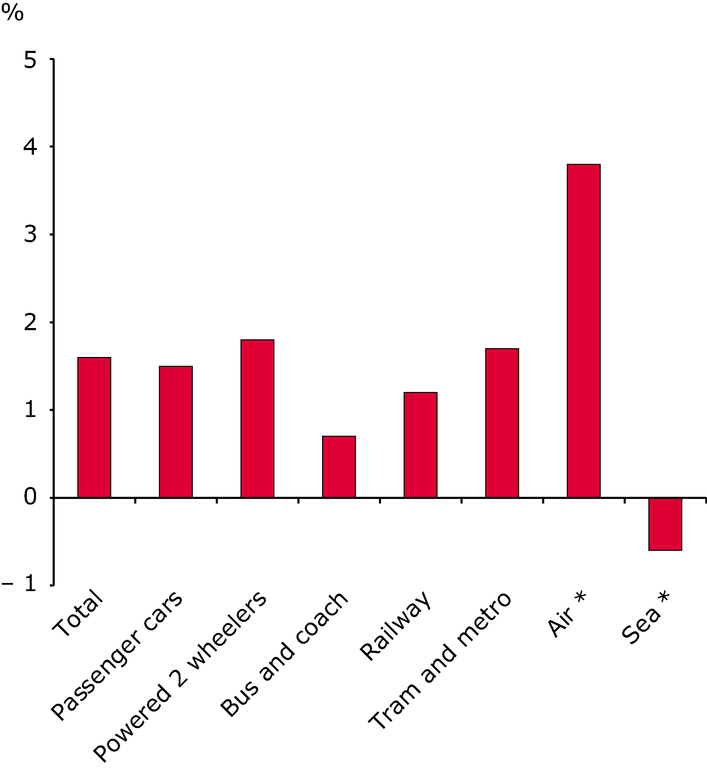
See all EU institutions and bodiesThe Figure is showing average annual growth rates of different means of transport within the EU-27 in the period between 1995-2008. (Actual yearly growth rates are of course differing from the averages used in the figure) The values for Air and Sea travel only include domestic and Intra-EU-27 transport. Most numbers are based on estimates and data for Air and Sea are provisional estimates.
Loading

