All official European Union website addresses are in the europa.eu domain.
See all EU institutions and bodiesAnnual mean benzene concentrations
Map (static)
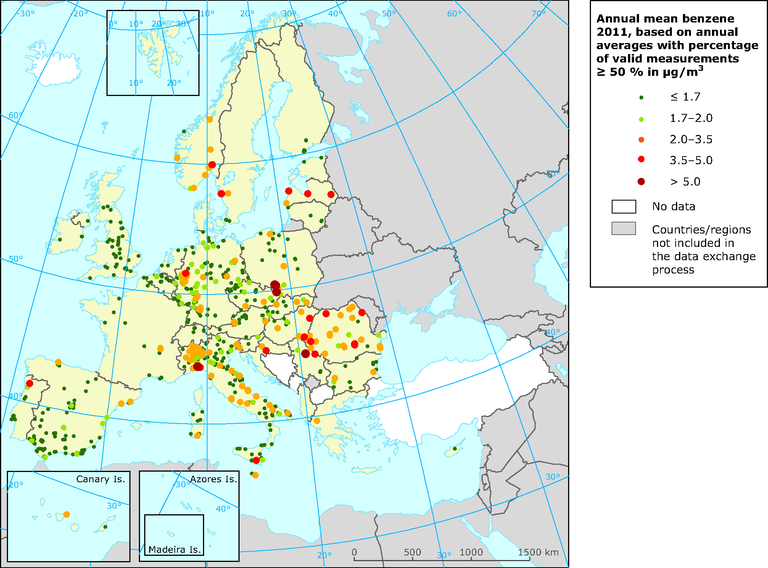
The map shows the annual mean benzene concentrations in 2011, based on annual averages with percentage of valid measurements >= 50% in μg/m3

- Albania
- Austria
- Belgium
- Bosnia and Herzegovina
- Bulgaria
- Croatia
- Cyprus
- Czechia
- Denmark
- Estonia
- Finland
- France
- Germany
- Greece
- Hungary
- Iceland
- Ireland
- Italy
- Latvia
- Liechtenstein
- Lithuania
- Luxembourg
- North Macedonia
- Malta
- Montenegro
- Netherlands
- Norway
- Poland
- Portugal
- Romania
- Serbia
- Slovakia
- Slovenia
- Spain
- Sweden
- Switzerland
- United Kingdom
Additional information
Dark green dots correspond to concentrations under the WHO reference level (1.7 μg/m3).
Pale green dots correspond to concentrations under the lower assessment threshold (2 μg/m3).
Orange dots correspond to concentrations between the lower and the upper assessment threshold (3.5 μg/m3).
Red dots correspond to concentrations under the limit value of 5 μg/m3 but higher than the upper assessment threshold.
Dark red dots correspond to concentrations exceeding the limit value of 5 μg/m3.
The data coverage criterion has been set to 50 % by an European Commission working group on benzene (Mol et al., 2011).
