All official European Union website addresses are in the europa.eu domain.
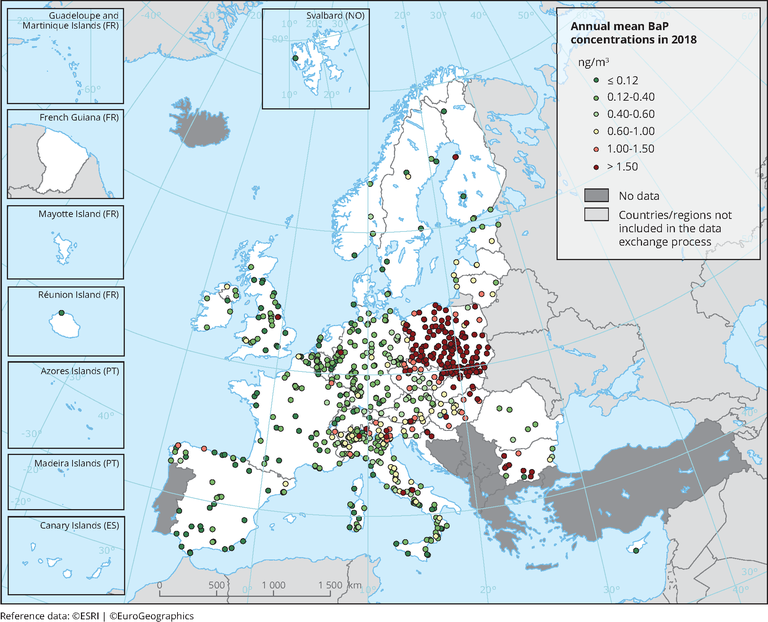
See all EU institutions and bodiesObserved concentrations of BaP in 2018. Dots in the first colour category correspond to concentrations under the estimated RL (0.12 ng/m3). Dots in the last colour category correspond to concentrations exceeding the 2004 Ambient Air Quality Directive target value of 1 ng/m3.
Only stations reporting more than 14 % of valid data, as daily, weekly or monthly measurements, have been included in the map.
Loading

