All official European Union website addresses are in the europa.eu domain.
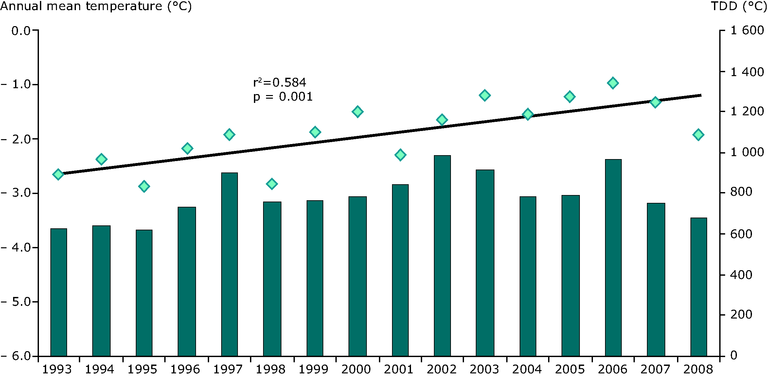
See all EU institutions and bodiesThe graph shows the annual mean air temperature (black dots and regression line) and thawing degree days (TDD; bar plot), i.e. temperature sum > 0°C, from May to September at Latnjajaure, northern Sweden, during 1993–2008.
Loading

