All official European Union website addresses are in the europa.eu domain.
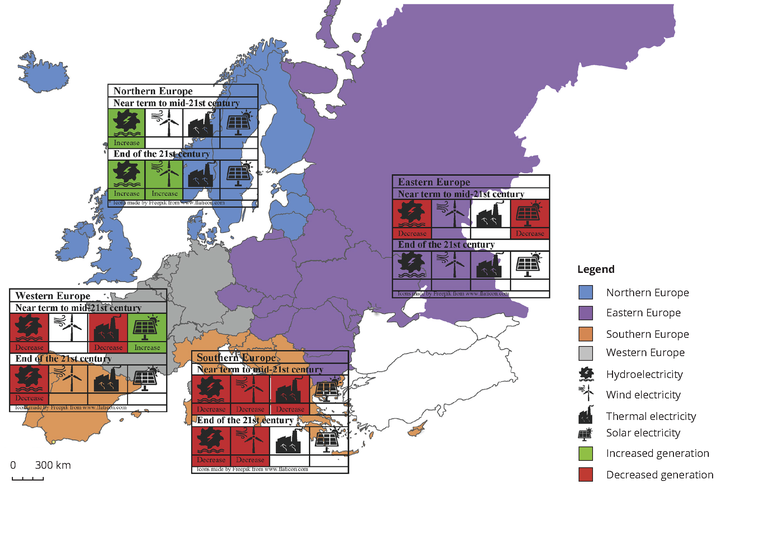
See all EU institutions and bodiesThis map shows the projected impacts of climate change on electricity production from four different sources in four European regions. Green denotes positive impacts whereas red denotes negative impacts.
Loading

