All official European Union website addresses are in the europa.eu domain.
See all EU institutions and bodiesAn official website of the European Union | How do you know?
Environmental information systems
Phosphorus emission intensity of agriculture
Chart (static)

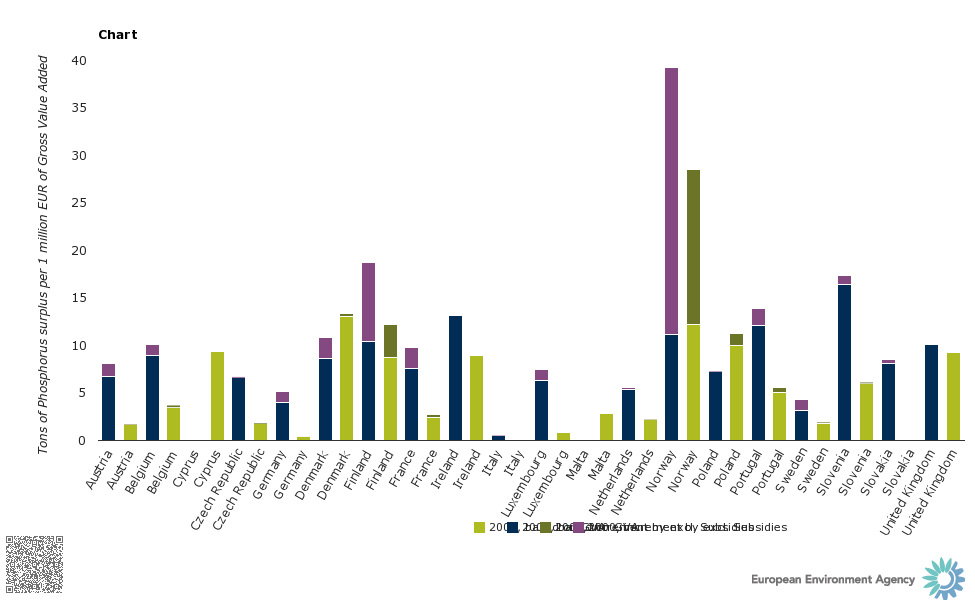
The chart displays changes in Phosphorus emission intensity of agriculture in 2000 and 2008, respectively. Phosphorus emission intensity is expressed in tons of Total Phosphorus surplus in agriculture per unit of production of agriculture industry (expressed as one million Euro gross value added, GVA). The lowest part of a stacked bar refers to emission intensity based on total GVA (which includes subsidies) and the entire stacked bar refers to emission intensity based on GVA, excluding subsidies.
Downloads
Data sources
Metadata
More info
- Gross nutrient balance N and P, Statistical Office of the European Union (Eurostat)
- National Accounts by 64 branches - aggregates at current prices , Statistical Office of the European Union (Eurostat)
- Economic accounts for agriculture - values at current prices, Statistical Office of the European Union (Eurostat)
- Austria
- Belgium
- Cyprus
- Czechia
- Denmark
- Finland
- France
- Germany
- Ireland
- Italy
- Luxembourg
- Malta
- Netherlands
- Norway
- Poland
- Portugal
- Slovakia
- Slovenia
- Sweden
- United Kingdom
2000
2008
